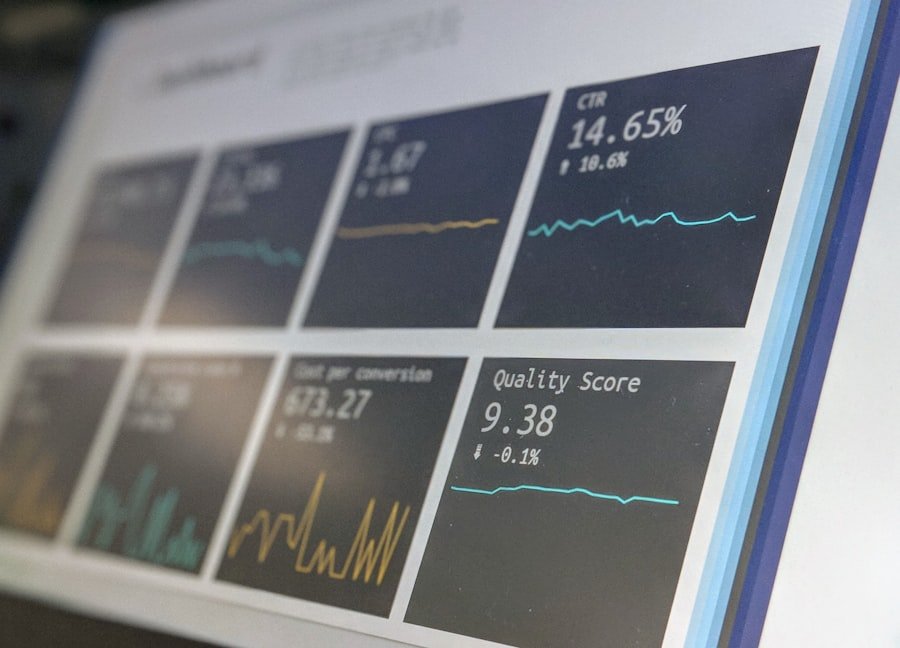

Site speed gets deprioritised because it sounds technical. Framed as revenue, it moves up the list quickly.

The Three Metrics
- LCP (Largest Contentful Paint) — when the main content appears. Target under 2.5s.
- INP (Interaction to Next Paint) — responsiveness to taps and clicks. Target under 200ms.
- CLS (Cumulative Layout Shift) — visual stability. Target under 0.1.
What Each Second Costs
Across the e-commerce and lead-gen sites we have measured, every additional second of LCP correlates with roughly a 7–12% drop in conversion rate. On a store doing $200,000 monthly, moving from 4.2s to 1.8s is not a technical improvement — it is a material revenue line.

Fixes, Ranked by Impact
- Images. Modern formats, correct sizing, priority hints on the hero. Usually the single biggest win.
- Third-party scripts. Audit every tag. Chat widgets, heatmaps and pixels are frequently the largest blocking cost.
- Fonts. Preload, subset, and use font-display: swap.
- Render-blocking CSS/JS. Split and defer anything not needed for first paint.
- Reserve space. Explicit dimensions on media kills most CLS.
Measure Field Data, Not Lab Scores
Lighthouse on a developer's machine is a simulation. Chrome UX Report and real-user monitoring tell you what actual visitors on actual networks experience — which is the only number that maps to revenue.
PerformanceWeb DesignCRO